 Tuna Industrial Platform™
SMART FACTORY
What a working digital factory looks like
A DDX assessment sets out what a plant needs. The smart factory is that need made to work, visible on the management dashboard, on the floor, and in the reports.
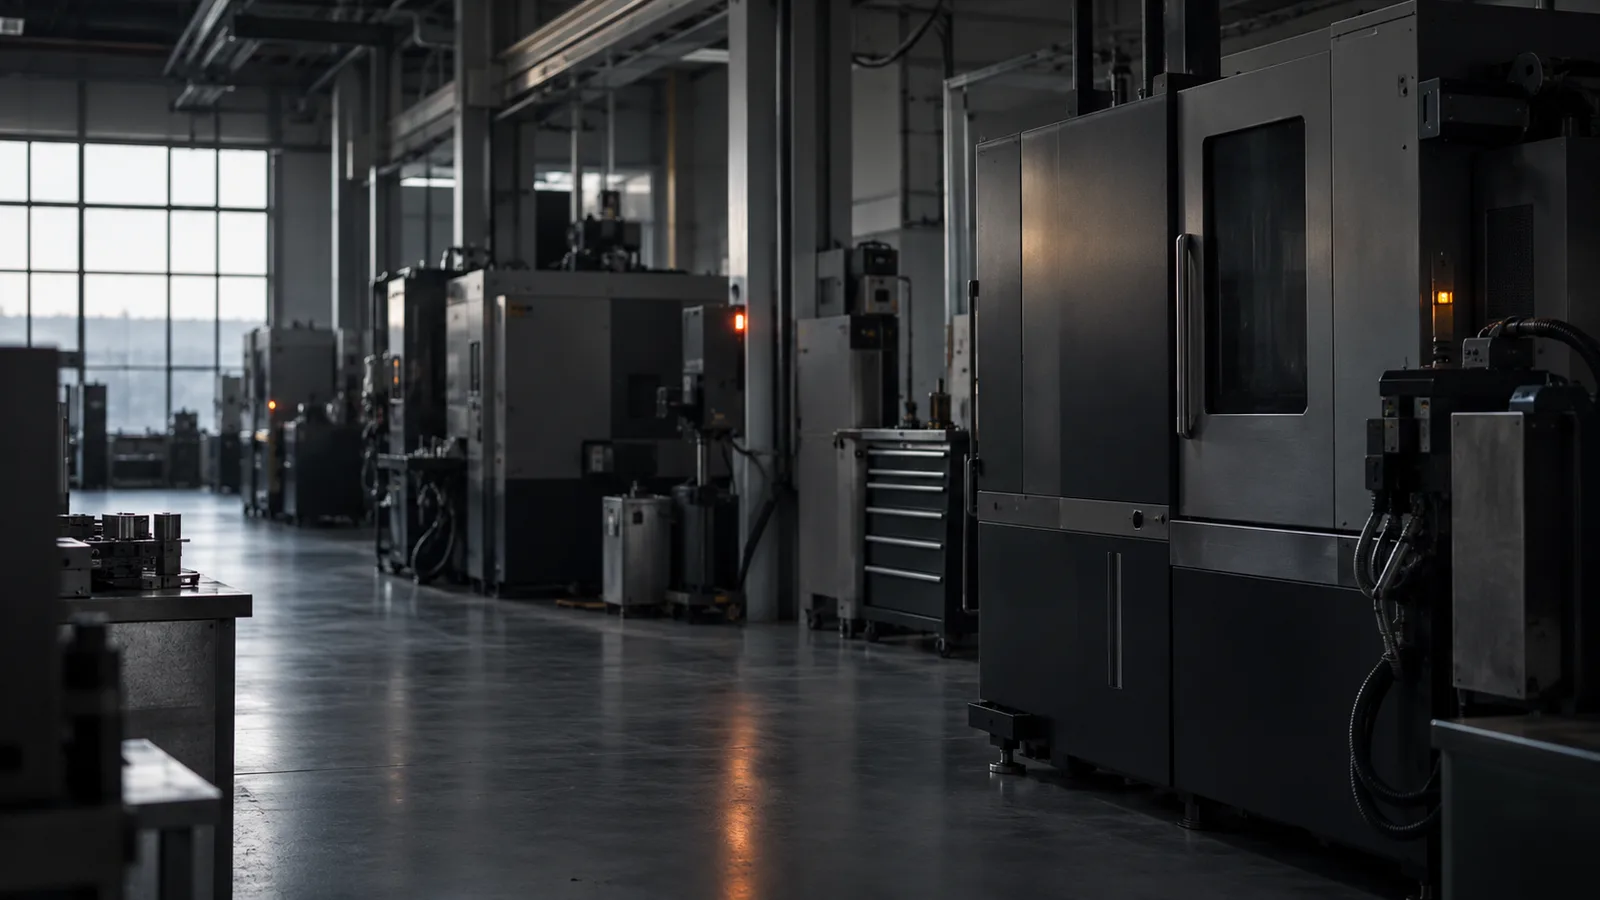
Today the data stays on the floor.
Which machine stopped and why: usually collected by hand after the shift ends.
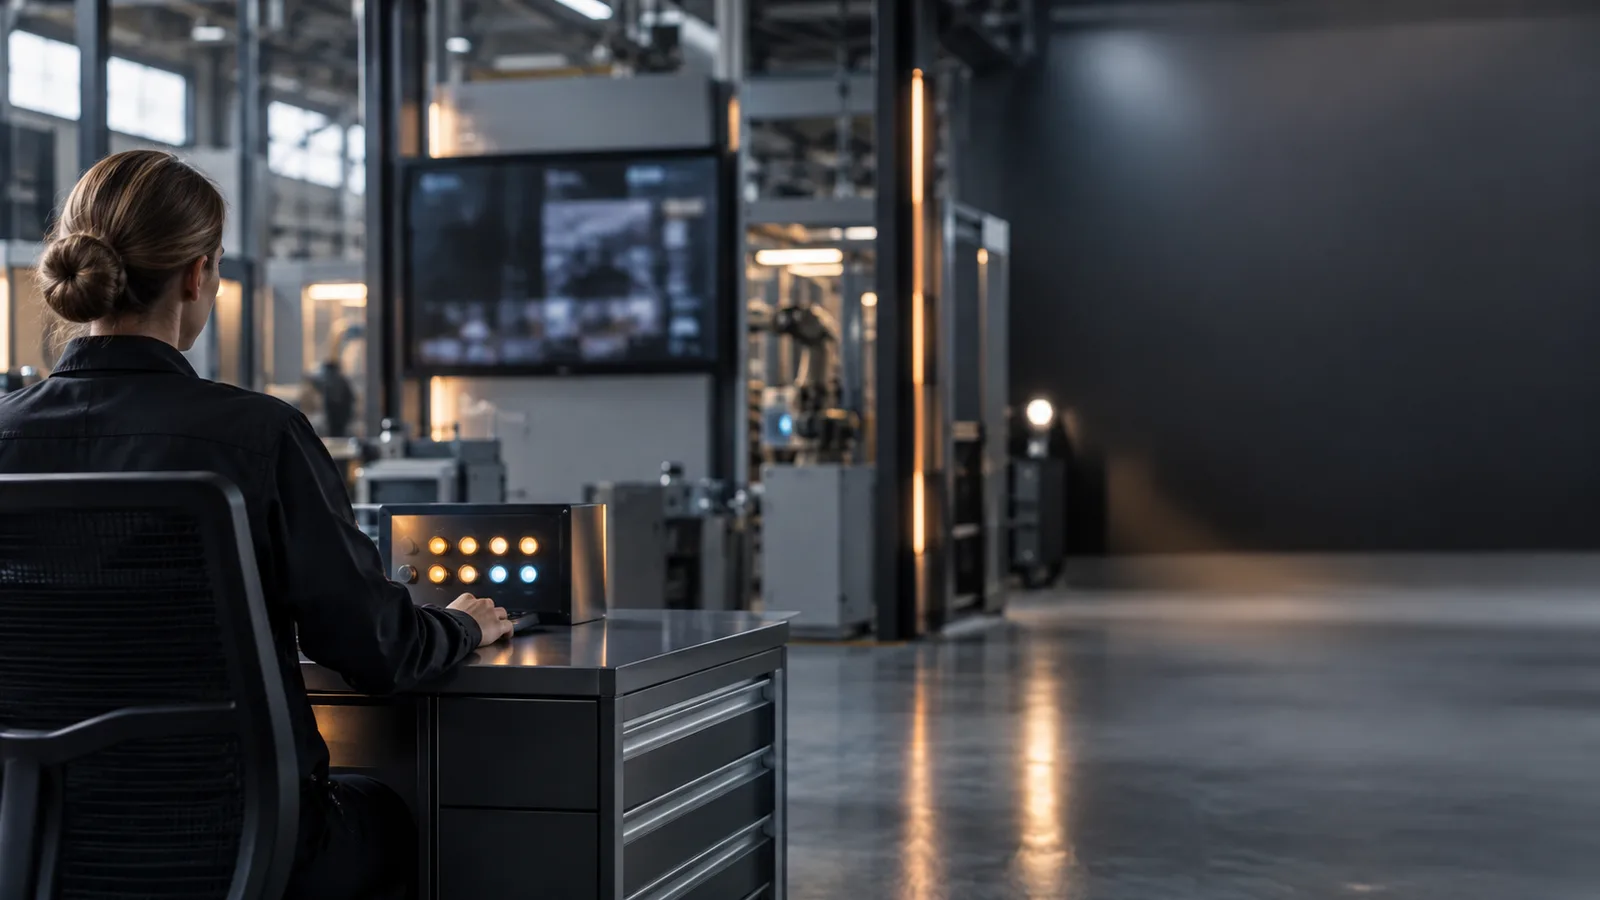
The same data collects in one panel.
OEE, downtime, scrap, material variance: one view, one place.
- OEE68%
- OEE is 68% in Shift 1. The product of availability, performance, and quality lands close to this figure.
- Target attainment82%
- 82% of the shift target was reached; the biggest gap came from a die-change stop on Line 2.
- Downtime causes41 dk
- Today's biggest downtime cause: a die change on Injection Press 2, 41 minutes.
- Scrap rates4%
- Line average is 4% scrap; the clear lid (TP-140) runs as high as 7%.
- Material variance3%
- Actual material consumption runs 3% off the standard recipe, mostly in the primary raw material line item.
- Shift comparison3 vardiya
- Lay three shifts of the same line side by side, and night shift downtime runs twice the others.
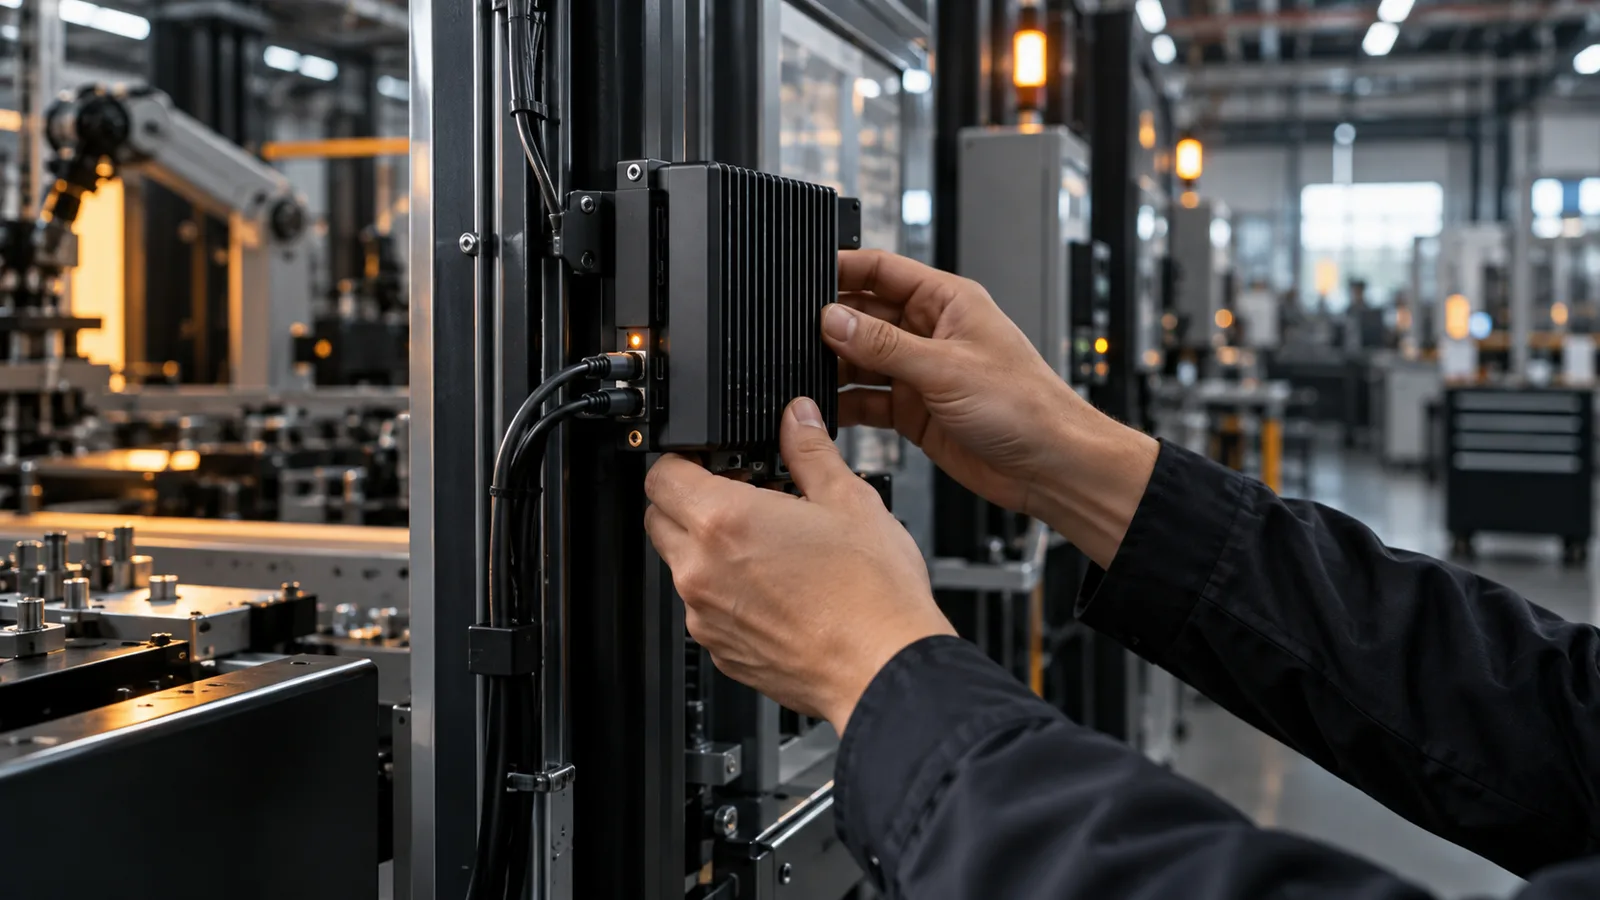
The scope stays deliberately narrow.
One production area, 3 to 10 machines. Deep, not wide, to start.

You can see it before anything is installed.
The Live Factory Demo shows the same panel in a simulated factory setting.
From diagnosis to a working system
Most manufacturing companies cannot see, in real time and with confidence, what is actually happening on the floor. Which machine stopped, why it stopped, and where the gap between plan and actual comes from are often pieced together by hand after the shift.
The smart factory closes that gap. The same data collects in one place, reads at a glance, and traces back to the measurement a decision rests on. The aim is a visibility layer used inside daily operations, not a presentation.
What the customer sees
- OEE
- Overall equipment effectiveness is gathered on one dashboard, broken down by line and machine, with a shift to shift comparison.
- Attainment
- The rate of reaching the production target is tracked by day and by shift, and where a shortfall forms is visible.
- Downtime causes
- Downtime duration and reasons are classified, and the reason that drives the most loss is ranked.
- Scrap rates
- Scrap and quality results collect by product and by machine, isolating the point where the rate rises.
- Material variance
- Actual material consumption is compared with the standard recipe and shown together with the size of the deviation.
- Shift comparison
- Shifts on the same line are placed side by side so recurring differences surface.
How a pilot starts
Complete discovery
A short discovery and a data and connectivity assessment are done. Which machines connect by which method, and which data is already available, become clear.
Narrow the scope
The pilot is kept deliberately narrow: one production area, 3-10 machines, and a limited set of users. The start is deep rather than wide.
Bring the pilot live
Once discovery is complete, this scope can be working within weeks. The exact duration depends on the discovery findings.
A pre-sale preview
On request, this experience can be seen through the Live Factory Demo before any deployment is built. The demo shows the same management dashboard in a simulated factory environment.
Once pilot success criteria are met, scope expands on the same platform to additional lines, to added capabilities such as quality and maintenance, or to other sites. Expansion does not require starting over each time.
The live factory demo runs on simulated factory data, it is not a real customer deployment.